tdigest-Chart
Chart generation from tdigest
https://github.com/futurice/haskell-tdigest#readme
| Version on this page: | 0@rev:2 |
| LTS Haskell 9.21: | 0@rev:2 |
| Stackage Nightly 2017-07-25: | 0@rev:2 |
| Latest on Hackage: | 0.2@rev:3 |
This version can be pinned in stack with:
tdigest-Chart-0@sha256:eb31675de925aad584642fd370627cb9a532e113a49a2fea1638450e558d388d,1728Module documentation for 0
- Graphics
- Graphics.Rendering
- Graphics.Rendering.Chart
- Graphics.Rendering.Chart.Plot
- Graphics.Rendering.Chart
- Graphics.Rendering
Depends on 8 packages(full list with versions):
tdigest-Chart
Examples
These are outputs of the test-suite
inkscape --export-png=example1.png --export-dpi=80 --export-background-opacity=0 --without-gui example1.svg
inkscape --export-png=example2.png --export-dpi=80 --export-background-opacity=0 --without-gui example2.svg
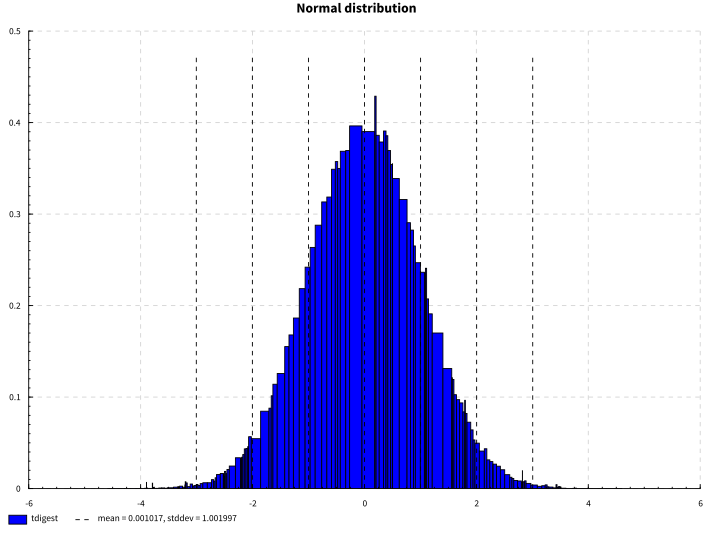
Standard normal distribution
Chart.layout_title Chart..= "Normal distribution"
Chart.plot $ do
    p <- Chart.tdigestPlot "tdigest" td
    return $ Chart.tdigestToPlot $ p
        & Chart.plot_tdigest_normalize .~ True
        & Chart.plot_tdigest_deviations .~ Just 3
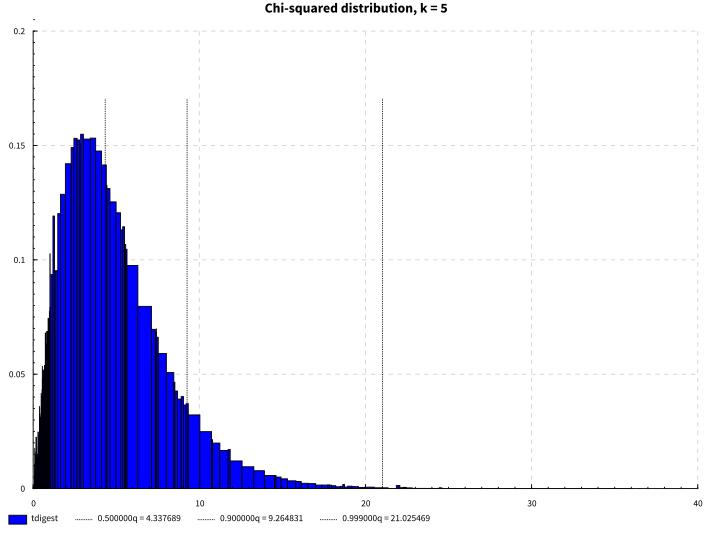
Chi-squared distribution, k = 5
Chart.layout_title Chart..= "Chi-squared distribution, k = 5"
Chart.plot $ do
    p <- Chart.tdigestPlot "tdigest" td
    return $ Chart.tdigestToPlot $ p
        & Chart.plot_tdigest_normalize .~ True
        & Chart.plot_tdigest_quantiles .~ [0.5, 0.9, 0.999]