
BlogLiterately-diagrams
Include images in blog posts with inline diagrams code
| Version on this page: | 0.2.0.3 |
| LTS Haskell 9.21: | 0.2.0.5 |
| Stackage Nightly 2017-07-25: | 0.2.0.5 |
| Latest on Hackage: | 0.3.1 |
BlogLiterately-diagrams-0.2.0.3@sha256:32a007ae3962cc50946fcdede4a787e975bb545582a92620eede9de52c43a966,4611Module documentation for 0.2.0.3
- Text
- Text.BlogLiterately
A plugin for BlogLiterately (http://hackage.haskell.org/package/BlogLiterately) which turns inline diagrams
code into images.
This library also provides an executable,
BlogLiteratelyD, providing a standard instance
of BlogLiterately extended with support for
inline diagrams code. For most users it
should suffice to simply use BlogLiteratelyD in
place of BlogLiterately.
To use it, include code blocks with the dia or
dia-def class (using pandoc's special extended
Markdown syntax
(http://johnmacfarlane.net/pandoc/demo/example9/pandocs-markdown.html),
or BlogLiterately's extended syntax for tagged
code blocks
(http://byorgey.wordpress.com/blogliterately/)),
like so:
[dia-def]
-- This block produces no output but its
-- declarations will be in scope in all the
-- rest of the diagram blocks.
gSq = square 1 # fc green
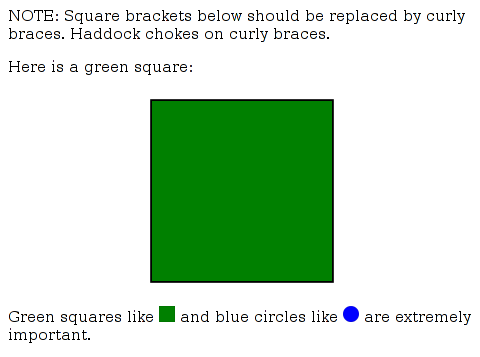
NOTE: Square brackets below should be replaced
by curly braces. Haddock chokes on curly
braces.
Here is a green square:
```[.dia width='200']
dia = gSq
```
Green squares like `gSq`[.dia height='16']
and blue circles like `circle 1 # fc blue`[.dia height='16']
are extremely important.Note that attributes like width and height can also be specified, but be sure to put the numbers in quotes or else they will not parse properly.
Running this through BlogLiteratelyD (after
replacing square brackets with curly braces)
should result in HTML that looks something like
this:
In addition to simple diagrams, IO actions
producing diagrams may also be used. In that
case the IO action will simply be run, and the
resulting diagram rendered. This can be useful,
for example, when producing a diagram built from
some external data or using randomness.